Has anyone got a idiots guide to getting these up and running. I’ve adding export_prometheus_metrics to config.exs no problem it’s the other steps
Running 3.6.0-0-g71d0899
Thanks
Has anyone got a idiots guide to getting these up and running. I’ve adding export_prometheus_metrics to config.exs no problem it’s the other steps
Running 3.6.0-0-g71d0899
Thanks
Where do you get stuck?
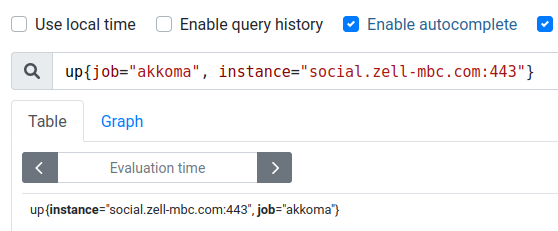
I got things as far as Prometheus reporting things are up:
So all that’s left is a nice Grafana Dashboard I hope…
Here’s what I have done so far:
Ran curl -sX GET 'localhost:4001/api/v1/akkoma/metrics' to establish the status quo
Updated secrets.exs with export_prometheus_metrics: true and restart
Ran curl again to see if there is a difference
Ran scripts/create_metrics_app.sh
Added job to prometheus.yml
- job_name: akkoma
  scheme: https
  authorization:
    credentials: 'token string'
  metrics_path: /api/v1/akkoma/metrics
  static_configs:
  - targets:
    - social.zell-mbc.com
The curl in #1 returns empty,. After secret.exs is changed curl in #3 returns a credential error which means the link now exist.
No need fo Constanze in my case…
Hey ! I’m giving it a go. (total noob, I’m trying to learn)
I managed to install prometheus but I’m stuck at finding the Oauth token. (used this comprehensive tuto for installation of prometheus : Monitoring Pleroma with Grafana and stuff - Coffee and Dreams)
Tried to use Constanze but I’m not sure how to install it. I’ve decompressd the tar and added to the path but it still wouldn’t work. I figured I made something wrong but wouldn’t be sure what ![]()
I’m on OTP so I tried to find something close enought to “scripts/create_metrics_app.sh” but failed.
I’m kind of stuck there
I wrote that guide 4 years ago (has it really been that long?) and it is now very outdated, do not rely on it
Does that script exist in your akkoma folder?
If not, I guess you could download from git and simply run it in your shell. Assuming you are not running Linux on your PC, you might have to execute it from your Linux server hosting Akkoma.
I had a quick look at the script, looks like you can run it from any machine with bash support.
Okay so finally I’ve achieved getting the metrics over to grafana !
My hardship as a total noob were (brace yourself, it’s not pretty) :
promtool check config prometheus.yml So now I have a lovely grafana board and I hope I’ll learn to understand all of those metrics.